

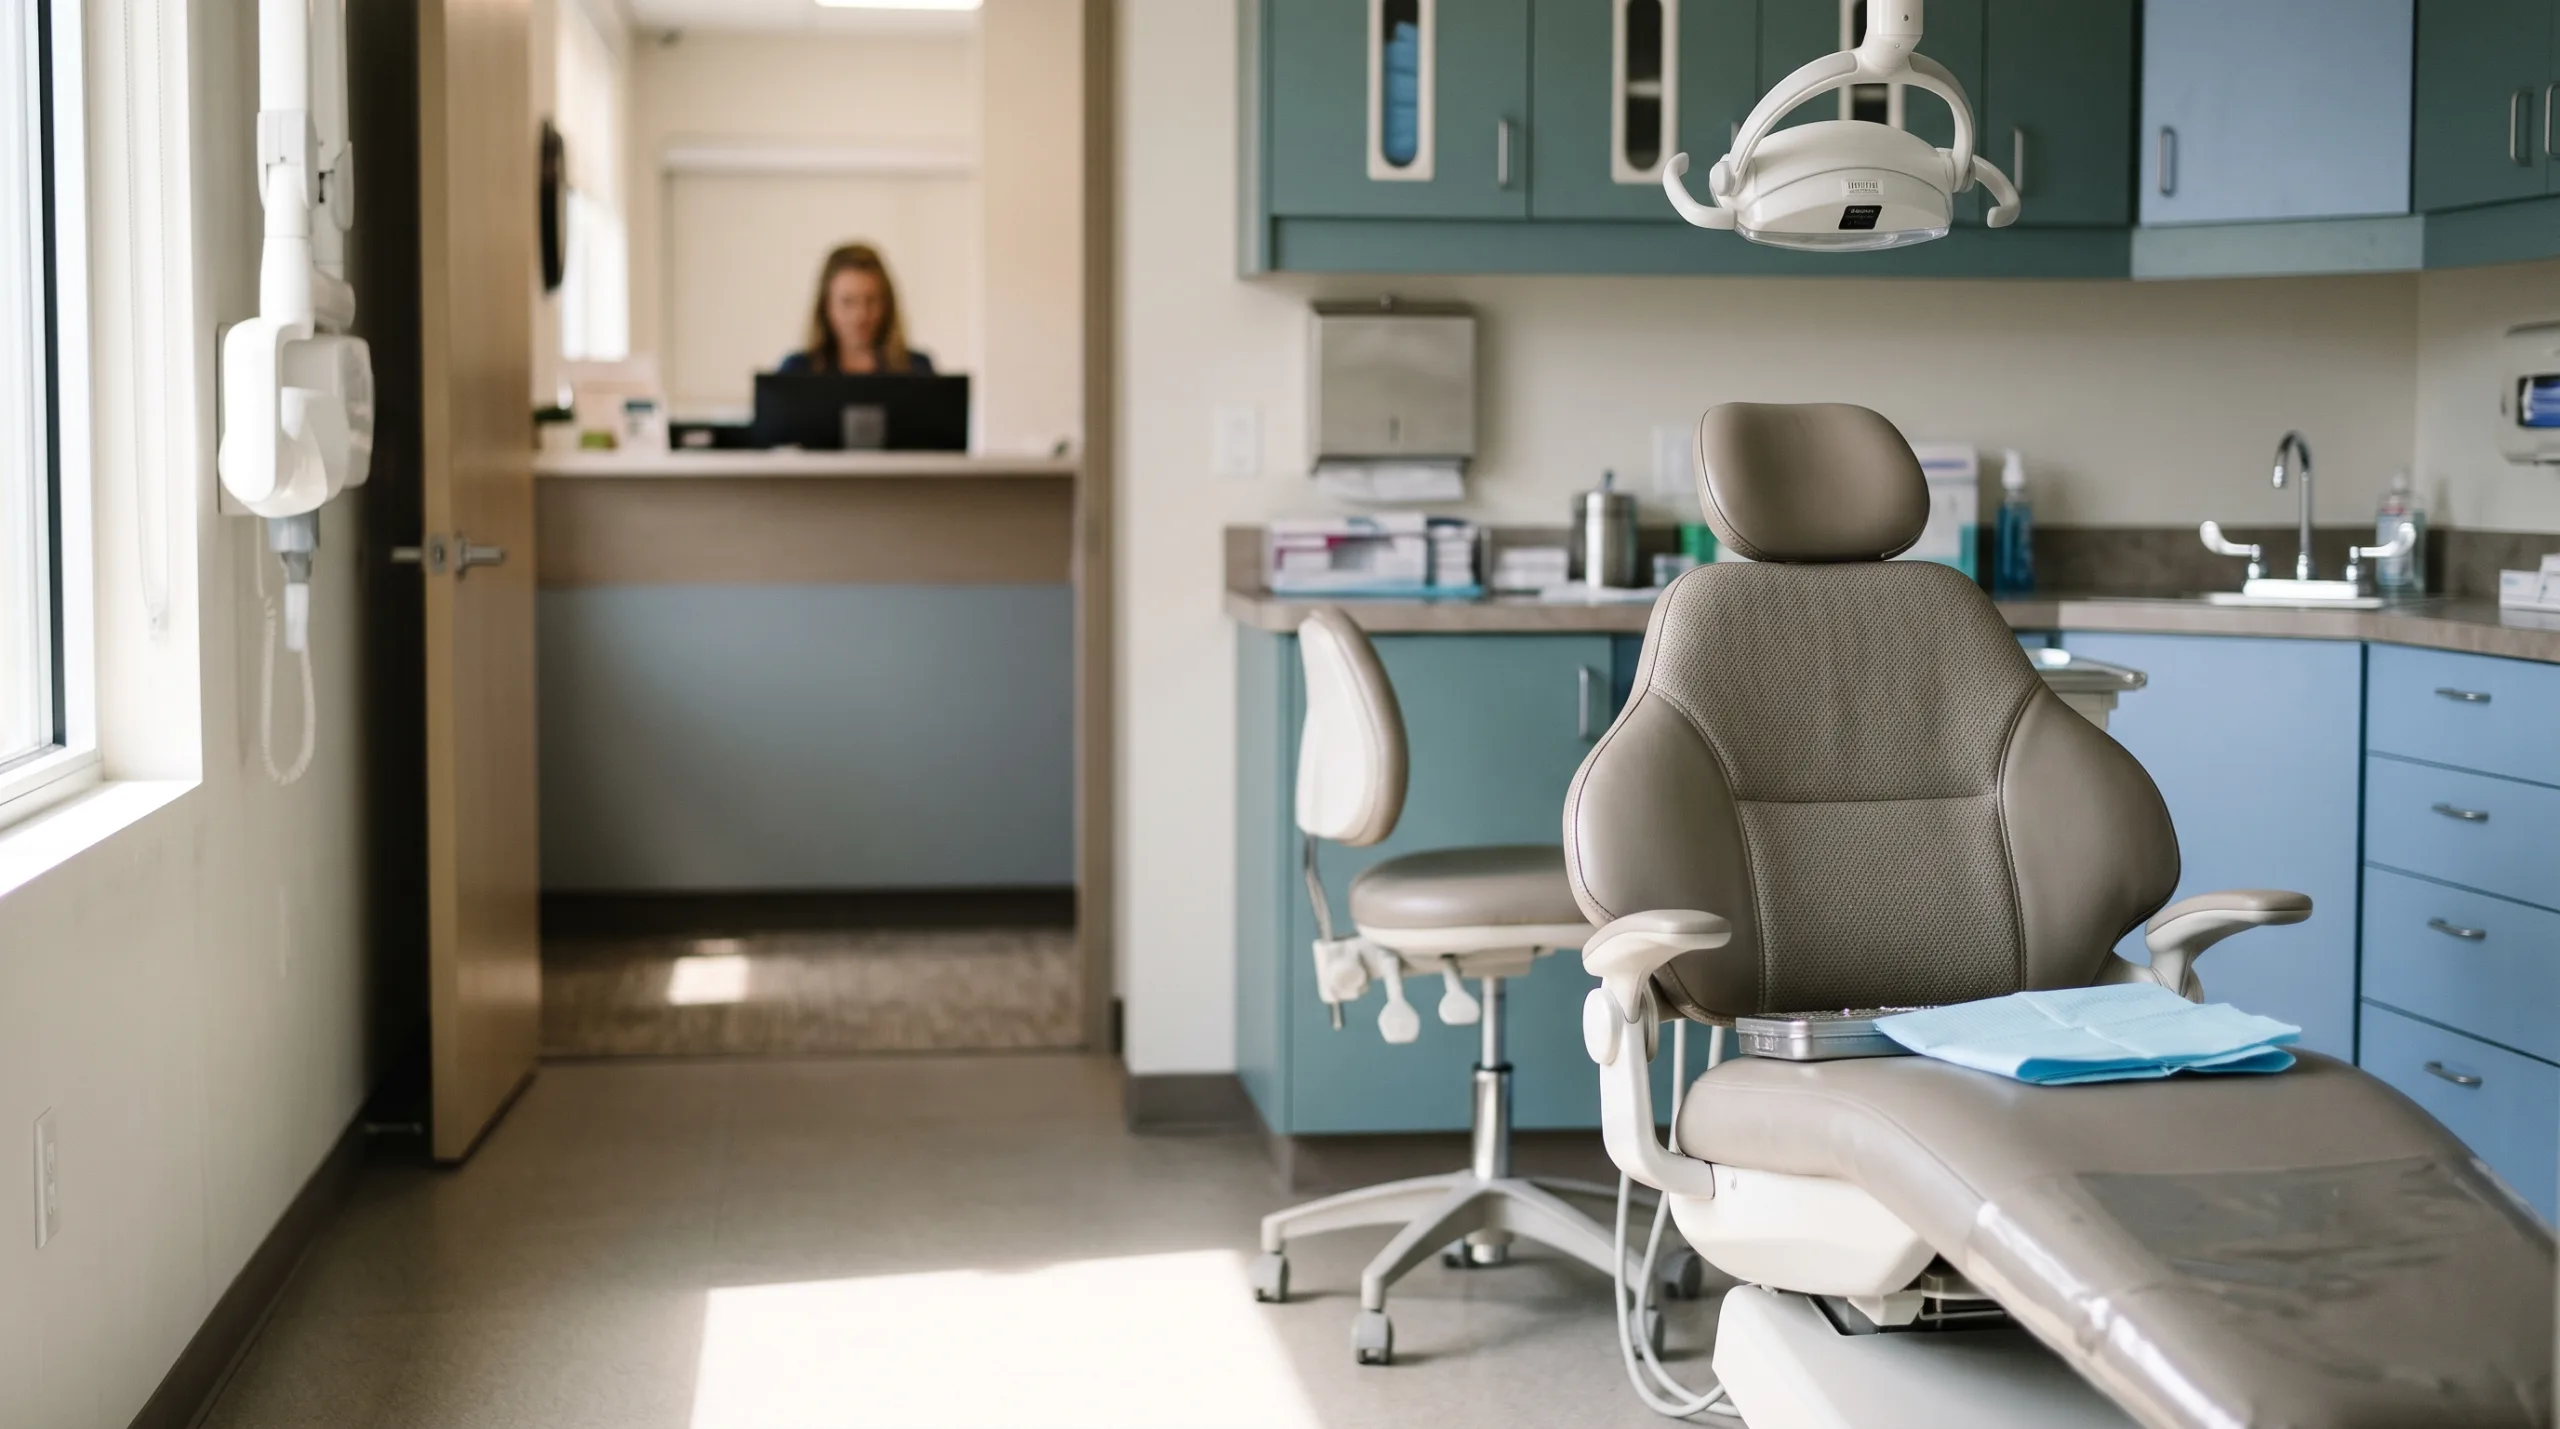
Picture an office manager on Monday morning, looking at a hygiene column on the schedule with a full day of booked patients and nobody to see them. The dental staffing shortage makes that picture common, but few offices have priced it. This post builds the P&L of one empty hygiene chair line by line, using published benchmarks and clearly labeled assumptions you can swap for your own numbers, so you finish with a dollar figure per day, per week, and per month.
A vacant hygienist chair costs a practice roughly $1,500 in lost profit for every booked day it sits empty, according to the model below. The figure combines the hygiene production that disappears, the restorative treatment that would have been diagnosed in that chair, and the overhead that keeps running anyway. Your number will differ, so every assumption is shown.
Production per hygiene hour starts with the hygienist’s own wage
he Bureau of Labor Statistics puts the median dental hygienist wage at $47.16 per hour, based on May 2025 data. That wage is the anchor for the first line of the model, because the most common hygiene benchmark ties production to pay. Dental Economics writes that a hygienist should produce about three times their wages, and a hygiene benchmark piece from Patient Prism in 2023 uses the same three-times target for department compensation.
Assumption one: the chair produces three times the median wage. Three times $47.16 is $141.48 of production per hygiene hour, or $1,132 across an eight-hour day. A more conservative benchmark of 2.5 times compensation appears in a DrBicuspid analysis built on Sikka Software data from more than 13,000 practices. If your office runs closer to that ratio, the daily figure at the end of this post falls to about $1,200 rather than $1,500, and the logic holds either way.
These numbers describe a chair that is booked. If your schedule already carries 10 percent open time, you are modeling a different practice. Patient Prism puts healthy open time at 8 to 10 percent of the hygiene schedule, so a fully booked day is a fair starting point for an office that has been running well.
Assumption one: the chair produces three times the median wage. Three times $47.16 is $141.48 of production per hygiene hour, or $1,132 across an eight-hour day.
Restorative diagnosis starts in the hygiene chair and flows to the doctor
Hygiene production is only the visible part. Dental Economics reports that the hygiene department should contribute 25 to 35 percent of gross practice production, and DentistryIQ puts the typical benchmark at 30 to 33 percent. Assumption two: hygiene is 30 percent of production. That leaves 70 percent on the doctor side, which is 2.33 dollars of doctor production for every dollar a hygienist produces.
The next question is how much of that doctor production starts in the hygiene chair. Dental Economics says about 75 percent of restorative needs are discovered during hygiene visits, and Patient Prism says about 60 percent of restorative treatment should be enrolled through hygiene. Assumption three: 60 percent of doctor-side production traces back to a hygiene visit, the lower of the two published figures.
The arithmetic runs like this. 2.33 times 60 percent is 1.4, so each dollar of hygiene production carries $1.40 of doctor-side production behind it. On a $1,132 hygiene day, that is another $1,585 in restorative diagnosis that does not happen. Gross exposure for one empty day reaches $2,716. Practices heavy in orthodontics or implant placement will see a smaller restorative share, because DentistryIQ notes that specialty procedures make the 30 percent mark harder to reach.
Rebooked patients recover a share of the loss, but only a share
Not every patient on that schedule disappears. Some call back and take a slot later in the month. Assumption four: 25 percent of the lost production is recaptured through rebooking. This is a judgment call with no published benchmark behind it, so treat it as the softest number in the model.
Taking 25 percent off $2,716 leaves $2,037 of production lost for the day. A recaptured patient also needs an open chair later, and a hygiene schedule running near capacity has few of those. If your practice carries a waitlist or flexible hours, raise the recapture rate. If your hygiene column is booked six weeks out, lower it.
The reason for the haircut is credibility. An owner reading a post like this knows that a claim of the full $2,716 would ignore patients who reschedule. Starting from a defensible number is the only way the rest of the arithmetic earns trust.
Overhead runs while the chair sits empty
Here the model separates itself from the usual shortcut. Overjet, citing the American Dental Association, reports that overhead runs 60 to 65 percent of collections for the average practice. A reader who applies that rate to $2,037 concludes that the practice keeps 38 percent, or $774, and loses little in profit terms.
That logic treats overhead as if it shrinks with production. It does not. Rent, utilities, software, front desk wages, the assistant, and the doctor’s chair time continue on the same day whether the hygiene room is full or dark.
Rent, utilities, software, front desk wages, the assistant, and the doctor’s chair time continue on the same day whether the hygiene room is full or dark.
Only two items disappear. Assumption five: the unpaid hygienist wage saves $377 ($47.16 times eight hours). Assumption six: supplies and lab fees, which one industry summary places at 6 to 8 percent of production, fall by 7 percent, or $143.
Subtract both from $2,037 and the profit lost for the day is $1,517. That is about 74 percent of the lost production, nearly double the 38 percent the shortcut suggests.
That is about 74 percent of the lost production, nearly double the 38 percent the shortcut suggests.
A month of vacancy costs about $30,000 in this model
Multiply the daily figure and the exposure becomes harder to wave away. Five working days at $1,517 is $7,587. A four-week vacancy, or 20 working days, is $30,348. Those figures count lost profit, not lost revenue, so they are the money that would have reached the owner’s bottom line.
Offices cannot assume a quick fix on the hiring side. The ADA Health Policy Institute reported in April 2026 that only 60 percent of dentists have an adequate number of hygienists, and that 91 percent of dentists who were recruiting or had recently recruited a hygienist called the process very or extremely challenging. The same analysis finds that staffing has stayed essentially unchanged for three years even as hygiene program enrollment hits record highs, because new graduates are replacing hygienists who leave rather than growing the workforce.
Retention pressure adds to the risk. In the 2026 GoTu State of Work Report, 60.6 percent of hygienist respondents report burnout. An office that holds a hygienist today still plans for an open chair tomorrow.
Coverage is worth buying at a price far above what a shift costs
The same model produces a break-even. If a covered day protects $2,037 of production and costs $143 in supplies, the office is better off paying any shift cost below $1,894 for the day, or roughly $237 per hour. Every office knows what a shift costs in its own market, so compare that figure to $237 and the answer shows up on the page.
That calculation assumes patients are booked and willing to see a different hygienist, which is the condition that matters. GoTu verifies every professional in its community and screens every office, and both sides rate and review each other after every shift. That record gives an office manager something to check before a new face sits in the chair.
GoTu also publishes an ROI calculator. It asks for the professional type, hourly rate, hours per day, and the revenue the shift supports, then returns a single-day direct profit and ROI. Use your real numbers there, in place of the assumptions above
Run your own numbers before the next chair goes empty
Every empty hygiene day costs roughly $1,500 in profit under these assumptions, and the ADA reports that hygiene staffing has held steady for three years. The decision in front of an owner or DSO leader is whether to carry that exposure or cover it.
GoTu has 200,000+ dental professionals across 50 states and 45,000+ dental offices already in its community, with more than 500,000 shifts filled. Find hygienist coverage for your empty chair and keep the schedule producing while you recruit. Then run the numbers on what each covered day returns.
References
- Dental Hygienists, Occupational Outlook Handbook. U.S. Bureau of Labor Statistics, data from May 2025, page modified August 27, 2026. https://www.bls.gov/ooh/healthcare/dental-hygienists.htm. Supports the $47.16 median hourly wage.
- “The successful hygiene department: Understanding the numbers,” Dianne Glasscoe Watterson, RDH. Dental Economics, July 15, 2015. https://www.dentaleconomics.com/science-tech/article/16391798/the-successful-hygiene-department-understanding-the-numbers. Supports the three-times-wages benchmark, the 25 to 35 percent hygiene production share, and the 75 percent restorative discovery figure.
- “Hygiene Benchmarks.” Patient Prism, August 18, 2023. https://www.patientprism.com/blog/hygiene-benchmarks/. Supports the three-times-compensation target, 8 to 10 percent open time, and the 60 percent of restorative treatment enrolled through hygiene.
- “Hygiene production as percentage of total production,” Rachel Wall, BS, RDH. DentistryIQ, October 18, 2018. https://www.dentistryiq.com/dental-hygiene/career-development/article/16367756/hygiene-production-as-percentage-of-total-production. Supports the 30 to 33 percent hygiene share benchmark and the effect of specialty procedures.
- “How does your hygiene production compare?” David Black, DDS. DrBicuspid, February 27, 2018. https://www.drbicuspid.com/dental-practice/article/15374084/how-does-your-hygiene-production-compare. Supports the 2.5-times-compensation benchmark and the Sikka Software data set of more than 13,000 practices.
- “Average Dental Office Overhead: Complete Breakdown by Practice Size.” Overjet, September 7, 2025. https://www.overjet.com/blog/average-dental-office-overhead-complete-breakdown-by-practice-size. Supports the 60 to 65 percent average overhead, attributed by Overjet to the ADA.
- “Dental Office Production 2026: Benchmarks, Strategies and Insights,” Amaya Johnson. GoTu, December 22, 2025. https://gotu.com/dental-practices/dental-office-production-2026-benchmarks-strategies-and-insights/. Supports the 6 to 8 percent supplies and lab fee range.
- “Dental hygienist shortage.” HPI Perspectives, American Dental Association Health Policy Institute, April 2026. https://www.ada.org/resources/research/health-policy-institute/dentist-workforce/dental-hygienist-shortage. Supports the 60 percent adequate staffing and 91 percent recruiting difficulty figures, and the three-year flat staffing finding.
- “Updated Dental Hygiene Workforce Solutions.” American Dental Hygienists’ Association, April 30, 2026. https://www.adha.org/wp-content/uploads/2026/04/PS_Updated_Dental_Hygiene_Workforce_Wolutions_2026-04-30.pdf. Supports the 60.6 percent hygienist burnout figure from the 2026 GoTu State of Work Report.
- “The value of a hygienist,” Trisha E. O’Hehir, RDH. Dental Economics, October 1, 2003. https://dentaleconomics.com/science-tech/article/16387706/the-value-of-a-hygienist. Supports the 40 to 85 percent range of restorative visits from hygiene cited in the FAQ.
- ROI Calculator. GoTu. https://gotu.com/dental-offices/roi-calculator. Supports the description of the calculator’s inputs and outputs.